Thank you for visiting!
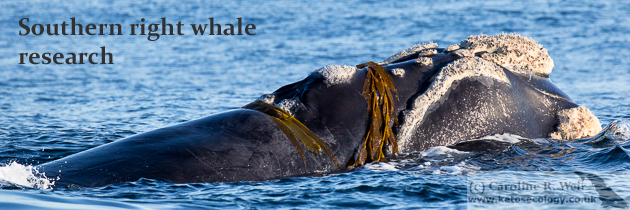
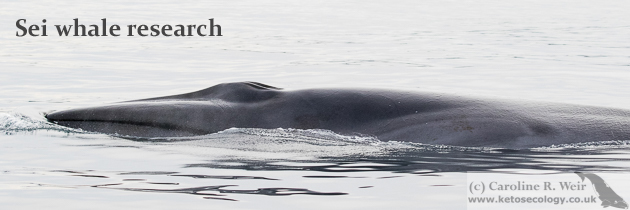
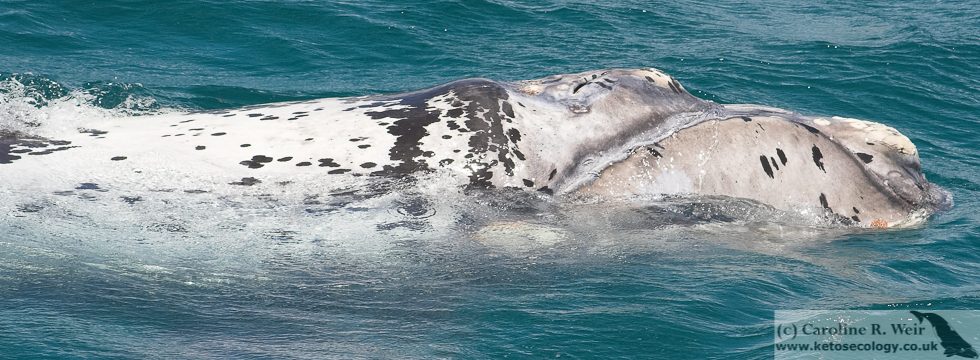
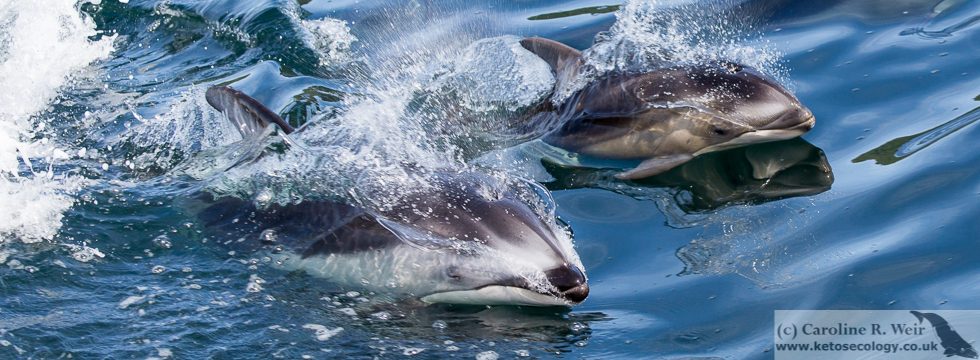
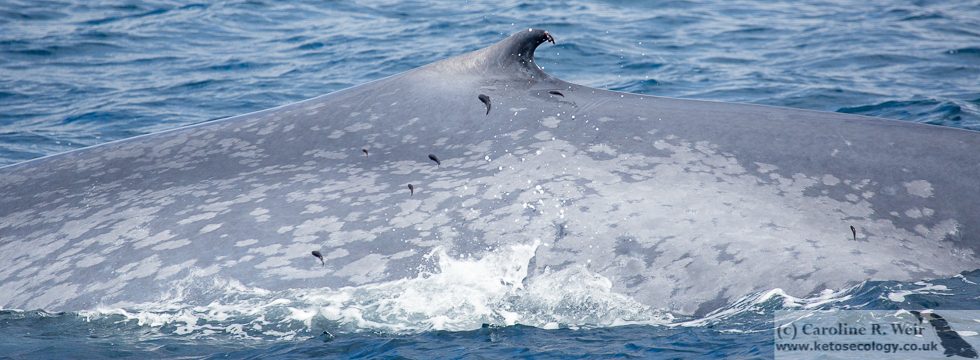
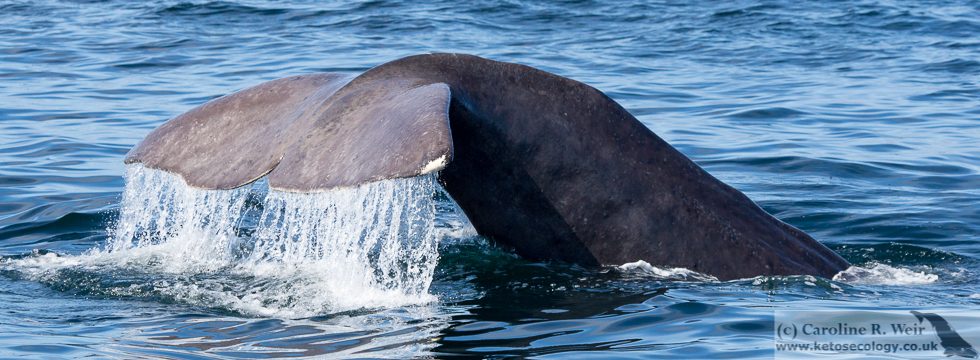
I am a cetacean scientist specialising in the distribution, ecology and conservation of whales, dolphins and porpoises. On this website you will find information about my current research focussed on sei whales and southern right whales in the Falkland Islands, and on some of my past research activities and consultancy work. Read more...